Part 1 of our series on Baseball Player Data
This blog represents the first of a series that will highlight normative DXA data for a variety of populations. Our goal is to make DXA norms easily accessible and also provide some context beyond traditional means. This one will focus on baseball players. The data in this blog was presented at last year’s American College of Sports Medicine (ACSM) annual meeting and comes from the Consortium for College Athlete Research (C-CAR). C-CAR is a group of Universities that pooled their DXA data to produce a larger cohort from which to report normative data. We are in the process of publishing a new study that is investigating asymmetries in arms, legs and trunk values in baseball players given the rotational nature and limb dominance for throwing and hitting. Stay tuned for part two on baseball soon.

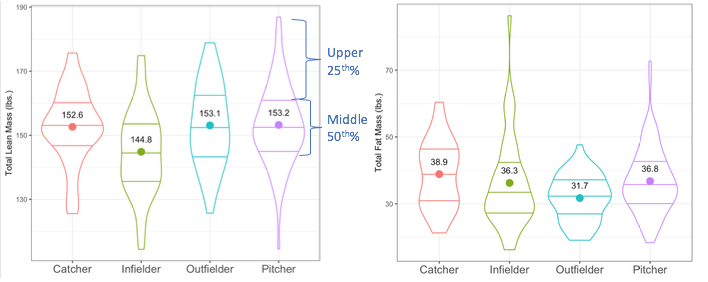
The first two plots in the graphs above show the distribution of total lean mass (mostly muscle) and total fat mass for each position. For each position there is a range of about 50-60 pounds for lean mass and 30-40 for fat mass. These plots show the density (the number of players with similar body types = the wider the plot) and also the quartiles (each line = 25% of players). Using that information, you see that for most positions 50% of all players fall within a range of 10-20 lbs. for both lean and fat mass.

We can use the lean mass index (Total Lean Mass in kg/height in meters2) to determine if height influences these measures (This is the same way BMI is used to determine the relationship of weight to height). The wide range (~8-10 kg/m2) of lean mass indices suggest that total lean mass is not dramatically influenced by height. Conversely, there is a slightly smaller range (~4-5 kg/m2) for fat mass index by position. These values may be a better way to think about lean and fat mass of players and to compare players both within and between positions. This is because height will be a primary driver of both total lean and fat mass. Adjusting for the height of the athletes will allow for more reliable comparisons of assessment of growth potential between players. Players that are high for indices will have limited growth potential, on average, because they have maximized the mass to their frame. Of note is that within pitchers and infielders there are sub-positions (i.e. 1B, 3B, starter, reliever), that may influence the wider ranges observed. A larger cohort is probably needed to investigate these positions as specialization is not as consistent in college players. College players will more often play more positions than specialize in a single position compared to professionals. Thus a team that scans their organization regularly will be able to narrow the variance and identify the physical growth and development of players coming into their organization.
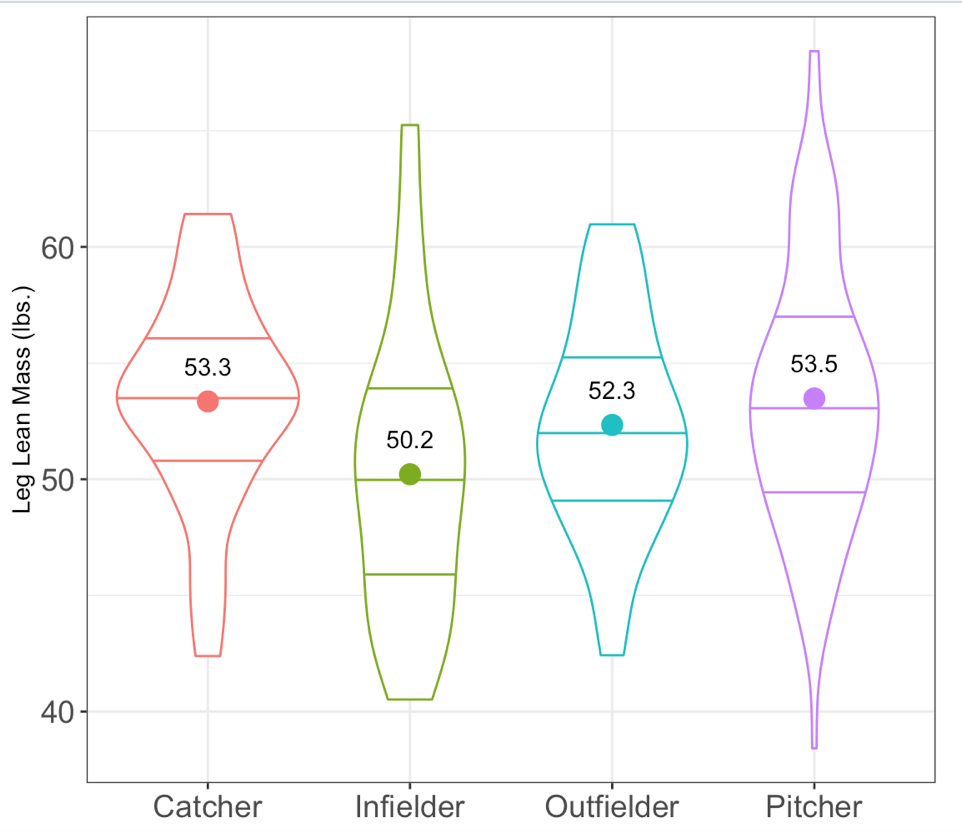
Next, let’s look at some regional measures in these players. We see similar ranges of both trunk and leg lean mass measurements between positions. The same idea could be used here - looking at trunk and leg lean mass indices to compare these measurements by height to determine if players are above or below norms for their team.

This becomes a way to “frame size” players and determine if they have the ability to add more mass to their frames or if they are near their limit. While other frame sizing methods exist to do this, using DXA provides the most reliable way because of the between-player reliability of the data and the ability to measure bone segments directly. Other body composition methods are two component models (Fat vs not fat) and also have low between-player reliability. This means that the data should really not be compared between other people, which is important when trying to identify the development potential of players. This information becomes very useful when you look at functional capacities of the players in parallel. Pairing this data with other data types including force plate profiles; pitching velocity; and/or exit velocity can provide critical insight into how players are using their mass or the functional capacity of that mass.
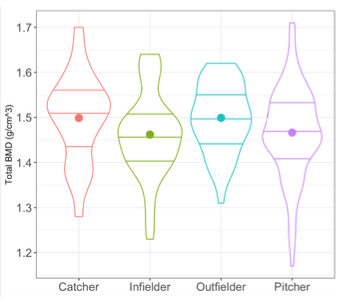
Finally, we can compare some bone density values between position. While bone stress injuries are not that common in baseball players, having normative values for this population can provide useful information for making decisions about players if the team has nutritional concerns. Bone density factors in bone size so it becomes an easy comparison between all players. Here we see similarities in BMD for each position. Just remember though that if players are in the lowest 25th percentile, follow-up data is required before making decisions about their BMD status. Some individuals can be low based on a variety of factors, including genetics.

Part two of our baseball blog will focus on mass asymmetries in baseball players…we just have to wait until we publish it.
About the Author: Tyler Bosch, PhD is a Research Scientist in the College of Education and Human Development at the University of Minnesota, and is a co-founder of Dexalytics.